


Environmental Activities
Greenhouse Gas/Energy Mgt. Activities
Power generation business using renewable energy
ClosePower Generation Business Using Renewable Energy
The DL Group actively develops renewable energy power plants including solar energy, wind power, and hydroelectric power to mitigate greenhouse gas emissions and expand clean energy diffusion. We will fulfill our environmental responsibility as a global company through continuous investment increase in the renewable energy sector.
- Metro Wind Power Generation
- Capacity: 50 MW
- Commercial operation: 2016
- Country: Pakistan
- Investor: DL Energy
- Gul Ahmed Wind Power Generation
- Capacity: 50 MW
- Commercial operation: 2016
- Country: Pakistan
- Investor: DL Energy
- Hawa Wind Power Generation
- Capacity: 50 MW
- Commercial operation: 2016
- Country: Pakistan
- Investor: DL Energy
- Gulpur Hydroelectric Power Generation
- Capacity: 102 MW
- Commercial operation: 2020
- Country: Pakistan
- Investor: DL E&C
- Tafila Wind Power Generation
- Capacity: 52 MW
- Commercial operation: 2020
- Country: Jordan
- Investor: DL Energy
- Poseung Biomass Power Generation
- Capacity: 43.2 MW
- Commercial operation: 2018
- Country: South Korea
- Investor: DL Energy
- PMGD Solar PV Power Generation
- Capacity: 105 MW
- Commercial operation: 2020
(based on general completion) - Country: Chile
- Investor: DL Energy
CDM (Clean Development Mechanism) business
View in detailCDM (Clean Development Mechanism) Project
The obligation to mitigate greenhouse gas emissions was given to developed countries through the UNFCCC (United Nations Framework Convention on Climate Change) in 1992 and the Kyoto Protocol in 1997. According to CDM, the greenhouse gas emission reduction amount can be acknowledged as reduction obligation performance through eco-friendly business (project) within the non-obligated countries.
The DL Group helps fulfill the greenhouse gas emission reduction obligation through the CDM projects in Chile and Pakistan.
UNFCCC
Kyoto Protocol
Joint Implementation
Clean Development
Mechanism (CDM)Emission Trading System
Acknowledgment of greenhouse gas emission reduction performance between greenhouse gas emission reduction countries
Greenhouse gas emission reduction performance between mandatory and non-mandatory greenhouse gas emission reduction countries
Permission of trading depending on reduction performance after the trading right is allocated to countries with reduction obligations
Chile’s PMGD Solar Photovoltaic Project
DL E&C is developing a 105MW solar PV project as part of the CDM project, so 140,000 tons’ greenhouse gas emission reduction is expected annually.
-
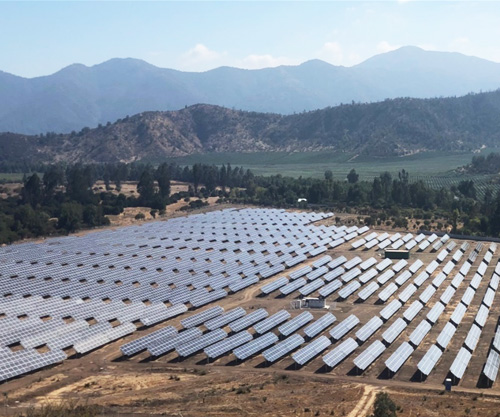 View of Santa Rosa 9MW
| Power generation type |
|
|---|---|
| Total cost |
|
| Capacity |
|
| Developer |
|
| Major schedule |
|
| Project lifespan |
|
| CDM approval schedule |
|
| Greenhouse gas (CO2) emission reduction amount |
|
Greenhouse Gas/Energy Management
View in detailManagement of Greenhouse Gas Emissions
DL E&C built the greenhouse gas inventory system in 2009 to cope with climate change, one of the most serious environmental problems worldwide; it has been making efforts to reduce greenhouse gas emissions generated from our construction sites and DL E&C’s head office building. We have ensured data reliability through third-party voluntary verification, and we have been continuously improving the system.
| Section | Direct emissions | Indirect emissions | Other indirect emissions | Total | Carbon intensity (tCO2-e/TJ) | Energy intensity (TJ/100 millionKRW) | |
|---|---|---|---|---|---|---|---|
| 2021 | Domestic | 17,013 | 32,932 | 116,220 | 166,165 | 64.3 |
0.055 |
| Overseas | 6,149 | 957 | 16,972 | 24,078 | |||
| 2020 | Domestic | 16,000 | 39,344 | 147,584 | 202,928 | 64.9 |
0.060 |
| Overseas | 10,397 | 1,170 | 27,414 | 38,981 | |||
| 2019 | Domestic | 13,753 | 41,813 | 149,746 | 205,312 | 64.8 |
0.056 |
| Overseas | 7,174 | 2,547 | 7,564 | 17,285 | |||
Greenhouse Gas Emissions for the Past 3 Years
Download Verification Certificate of Greenhouse Gas Emissions
Energy Usage Management
DL E&C predicts GHG emissions by reviewing the expected energy consumption and sets reduction targets by classifying energy facilities according to the level of impact. In order to achieve the targets, we establish quantitative action plans and implement performance management to reduce energy consumption and GHG emissions.
Energy Consumption Data by Fuel (Domestic Business Site)
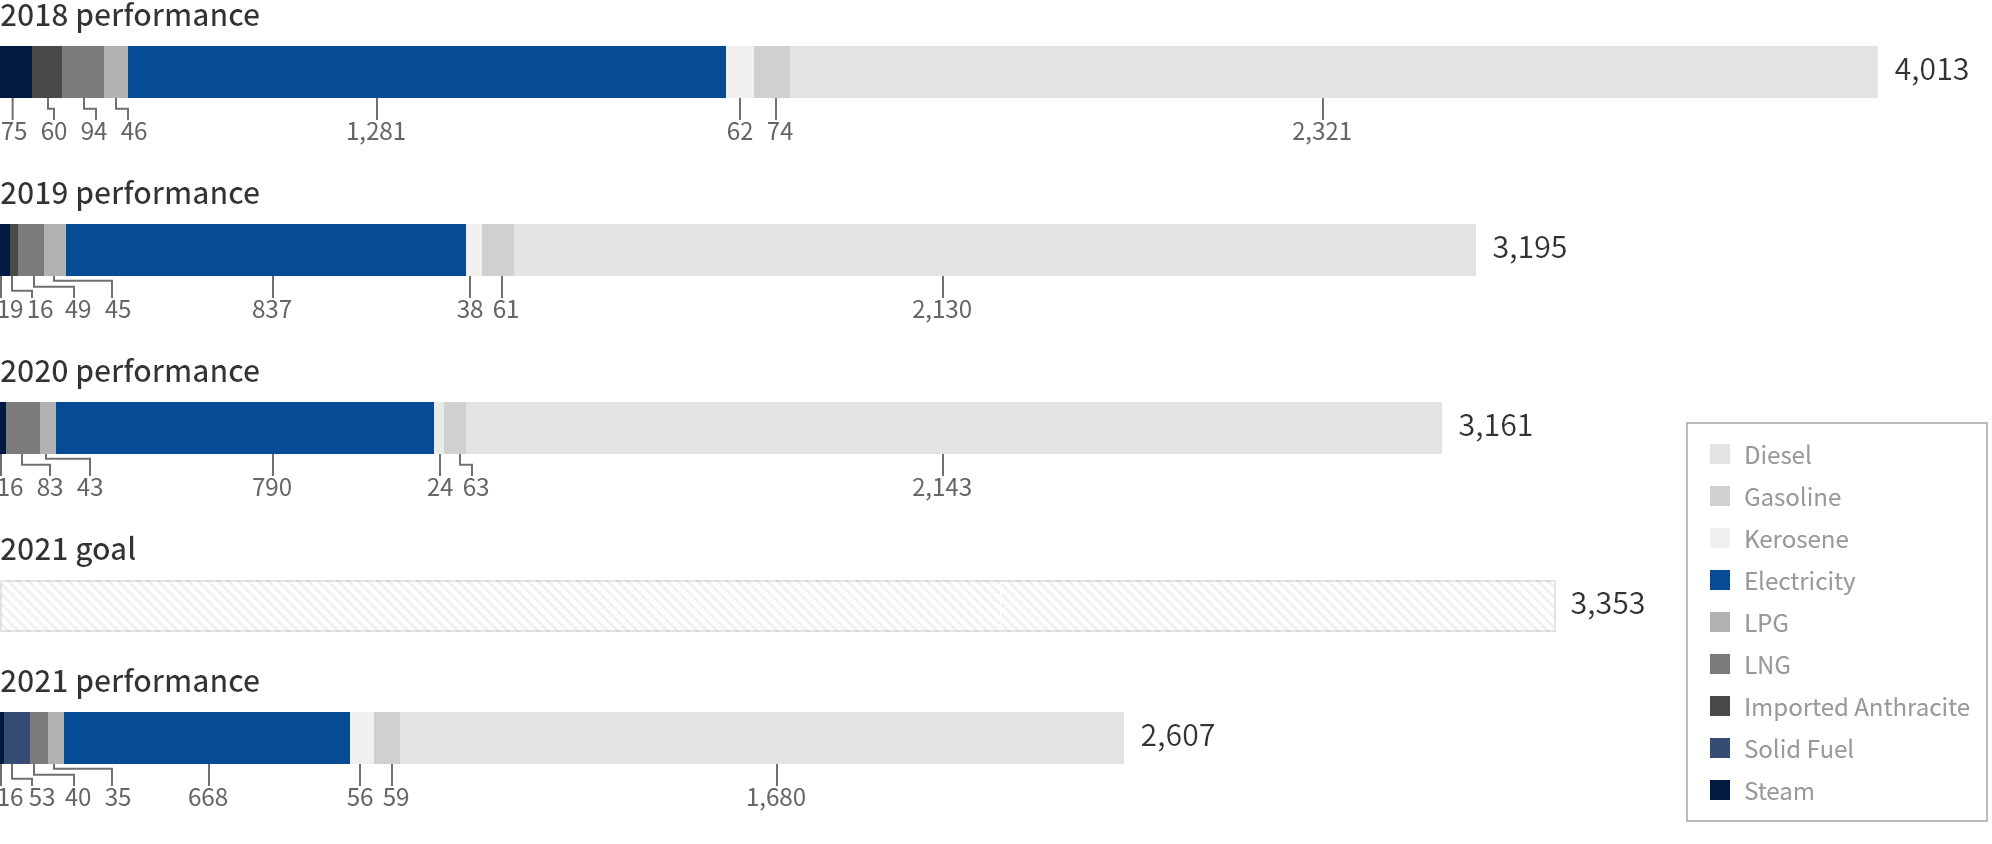
※ Energy Baseline (EnB) : 3 year average energy usage (‘18~’20)